Uster Statistics celebrates 60 years

Iris Biermann, Uster’s Head of Textile Technologies, presents the major features and reveals profit-boosting insights for spinning mills.

13th December 2018
Innovation in Textiles
|
Uster
Uster Technologies, a leading high-technology instrument manufacturer of products for quality measurement and certification for the textile industry, announced the launch of its 2018 edition of Uster Statistics in a mobile app format in October. Extended datasets and analyses, based on testing of many thousands of samples, cover a wider range of yarn types and applications than ever before, according to the manufacturer.
Iris Biermann, Uster’s Head of Textile Technologies, presents the major features and reveals profit-boosting insights for spinning mills.

Which innovation in Uster Statistics 2018 are most appreciated by users?
Iris Biermann: The extended range for blended yarns has received only positive feedback. With the new mobile app, we are proud to present a virtually seamless blended yarn range. Users can enter their chosen blend ratio in 1% steps. After entering the ratio, the graph with relevant quality data is selected, based on an intelligent algorithm running in the background. This feature fulfils requests from many users for more coverage of blended yarn types in Uster Statistics.
This is probably not the only new feature?
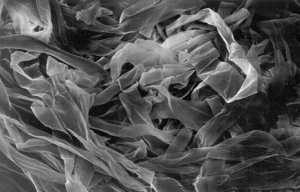
IB: Far from it. For example, there is now a new distinction between AFIS seed coat neps and fibre neps, to optimizs laydowns. These values mean spinners can also optimise efficiency in removing neps during further process steps, such as carding, as well as predicting more accurately the level of white spots on fabric after dyeing. As we know, the root cause of these white spots is a high level of fibre neps with a high proportion of immature fibres.
The big advantage of reliably predicting the appearance of white spots – thanks to Uster Statistics 2018 – is to minimize the risk of claims.
What other improvements can be achieved by studying the Statistics data?
IB: For Uster Statistics 2018, we used a new source for sliver and roving data. These are now based on Uster Tester generations 5 and 6. Personally, I recommend greater use of the Statistics to evaluate sliver and roving quality, with respect to evenness. A finisher sliver with poor evenness will be incapable of producing a yarn with good evenness. We know this from general experience. From a low-quality finisher sliver, a low-quality roving will be produced, ending up with a yarn of low quality, based on the evenness level.
So, would that be the end of the story for this product?
IB: Not exactly. Some collected samples did prove this, but from careful examination of all sample data, it is interesting that other finisher slivers – with a similar low quality – resulted in a medium quality rovings. In this case, we can conclude that the mill did a good job of processing the slivers. I assume they chose the perfect machine settings for drafting, for instance. And I’m convinced that their machine maintenance is at a high level, so that the top rollers are in optimum condition.
What other production benefits can spinning mills gain from the Statistics?
IB: The HL sensor of Uster Tester 6 offers new values, which provide a clear business advantage, as there is a strong correlation between yarn hairiness and fabric behaviour. If spinners compare the new hairiness values provided by the Tester with Uster Statistics 2018, they will, for example, obtain more sensitive indicators about traveler change cycles. Trials have shown that a mill can optimize traveler change cycles based on the S1+2u values – saving money and extending traveler working lifetimes. At the same time, the yarn quality stays consistent at the required level and fabric appearance does not change either.
Uster Statistics offer great advantages to spinners. What makes them so important to the wider textiles industry?
IB: As with the very first edition in 1957, Uster Statistics still assists the industry to determine fair market prices for a given yarn quality. That’s a big help for yarn producers, yarn consumers and traders alike. The many years of meticulous testing of yarns – as well as fibres, slivers, rovings, cops and packages – generates data which means much more to the textile industry than just benchmarks. Uster data and Uster equipment make the perfect combination for managing a textile mill with quality in mind.

Business intelligence for the fibre, textiles and apparel industries: technologies, innovations, markets, investments, trade policy, sourcing, strategy...
Find out more